

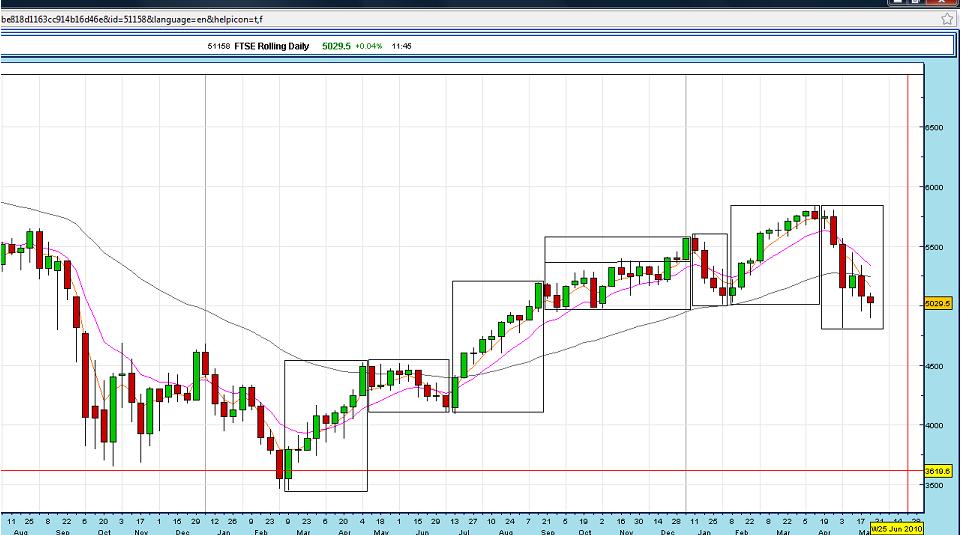
The current upward trend started in march 2009.
|
Weeks 1 to 9 (9 weeks)
|
Upward move
|
|
Weeks 10 to 18 (9 weeks)
|
Sideways
|
|
Weeks 19 to 28 (10 weeks)
|
Upward move
|
|
Weeks 29 to 44 (16 weeks)
|
Sideways with upward break out
|
|
Weeks 45 to 48 (4 weeks)
|
Downward retracement
|
|
Weeks 49 to 58 (10 weeks)
|
Upward move
|
|
Weeks 59 to 64 (6 weeks)
|
Downward retracement
|
Total weeks in trend 64
It’s interesting looking back at the FTSEs past performance. According to Pring in “Technical Anlaysis explained” (See the reading list) he states the following trend cycles in his “Market Cycle model”
Primary Trend:
- 9 months(39 weeks) to 2 years(104 weeks)
- Through to trough typically 3.6 years(187 weeks)
- Rising and falling trends typically 1 to 2 years ( 52 to 104 weeks)
- Bull trend lasts longer than bear trend, as it takes longer to build something than it does to tear it down
Intermediate Trend
- 6 weeks to 9 months(39 weeks)
- Sometimes longer rarely shorter
Short Term Trend
- Lasts 2 to 4 weeks
- Sometimes longer, sometimes shorter
- Influenced by random news events
- Much more difficult to identify than intermediate trends
If we apply these to the current FTSE chart then we get
|
Weeks 1 to 9 (9 weeks)
|
Upward move
|
Intermediate
|
|
Weeks 10 to 18 (9 weeks)
|
Sideways
|
Intermediate
|
|
Weeks 19 to 28 (10 weeks)
|
Upward move
|
Intermediate
|
|
Weeks 29 to 44 (16 weeks)
|
Sideways with upward break out
|
Intermediate
|
|
Weeks 45 to 48 (4 weeks)
|
Downward retracement
|
Sort
|
|
Weeks 49 to 58 (10 weeks)
|
Upward move
|
Intermediate
|
|
Weeks 59 to 64 (6 weeks)
|
Downward retracement
|
intermediate
|
As you can see the majority of them are intermediate movements with only one falling into the sort term trend category. I have purposely grouped these into intermediate trends as short term trends are too hard to spot.
So what can we conclude from this. Well this is where I really struggle so maybe someone reading this can lend me a hand. I’ll have a go but would love to hear comments from others regarding this.
Actually rather than trying to predict what is going to happen, I can only conclude as to what is currently happening. The price is retracing from the uptrend. There is no reason to suggest a new down trend is starting as there has been no reversal signs yet.
The assumptions we can make based on what is happening are,
- The price will return (or try to return to an uptrend)
- If the price rises but fails to pass the recent high of 5838 then this could signal the start of a new downward movement
- If the price recovers to 5838 the falls it could be the start of a new sideways market.
Either way my best guess here is that we will see a rise in the sort term at least. Will the rise continue? Well that’s anyones guess.